Home
Home Download
 News
News Mastodon
 Bluesky
 X
X Summary - 17 Years
 Summary - 16 Years
 Summary - 15 Years
 Summary - 13 Years
 Summary - 11 Years
 Summary - 10 Years
 Resources
 Technical Reference
 Scripting Tutorial
 Video Tutorials
 Wiki Pages
 Image Gallery
 Color Presets
 Using libgmic
 G'MIC Online
 Community
 Discussion Forum (Pixls.us)
 GimpChat
 IRC
IRC Report Issue
| Table of Contents ▸ List of Commands ▸ Image Drawing ▸ graph | ◀ gaussian | grid ▶ |
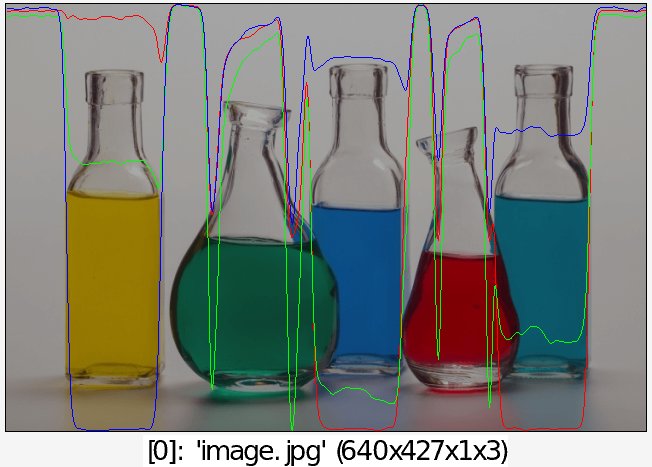
graph
Arguments:
- [function_image],_plot_type,_vertex_type,_ytop,_ybottom,_opacity,_pattern,_color1,...
Description:
Draw specified function graph on selected images.plot_type can be { 0:None | 1:Lines | 2:Splines | 3:Bar }.
vertex_type can be { 0:None | 1:Points | 2,3:Crosses | 4,5:Circles | 6,7:Squares }.
pattern is an hexadecimal number starting with 0x which can be omitted
even if a color is specified.
Default values:
plot_type=1, vertex_type=1, ytop=ybottom=0 (auto), opacity=1, pattern=(undefined)
and color1=0.Example of use:
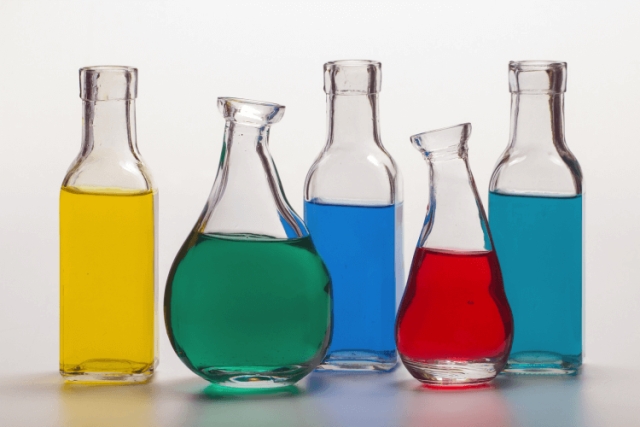
image.jpg +rows 50% blur[-1] 3 split[-1] c div[0] 1.5 graph[0] [1],2,0,0,0,1,255,0,0 graph[0] [2],2,0,0,0,1,0,255,0 graph[0] [3],2,0,0,0,1,0,0,255 keep[0]