Home
Home Download
 News
News Mastodon
 Bluesky
 X
X Summary - 17 Years
 Summary - 16 Years
 Summary - 15 Years
 Summary - 13 Years
 Summary - 11 Years
 Summary - 10 Years
 Resources
 Technical Reference
 Scripting Tutorial
 Video Tutorials
 Wiki Pages
 Image Gallery
 Color Presets
 Using libgmic
 G'MIC Online
 Community
 Discussion Forum (Pixls.us)
 GimpChat
 IRC
IRC Report Issue
| Table of Contents ▸ List of Commands ▸ Input / Output ▸ display_parametric | ◀ display_histogram | display_polar ▶ |
display_parametric
Arguments:
- _width>0,_height>0,_outline_opacity,_vertex_radius>=0,_is_antialiased={ 0:No | 1:Yes },_is_decorated={ 0:No | 1:Yes },_xlabel,_ylabel
Description:
Render 2D or 3D parametric curve or point clouds from selected image data.Curve points are defined as pixels of a 2 or 3-channel image.
If the point image contains more than 3 channels, additional channels define the (R,G,B) color for each vertex.
If outline_opacity>1, the outline is colored according to the specified vertex colors and
outline_opacity-1 is used as the actual drawing opacity.
Default values:
width=512, height=width, outline_opacity=3, vertex_radius=0, is_antialiased=1,is_decorated=1, xlabel="x-axis" and ylabel="y-axis".
Examples of use:
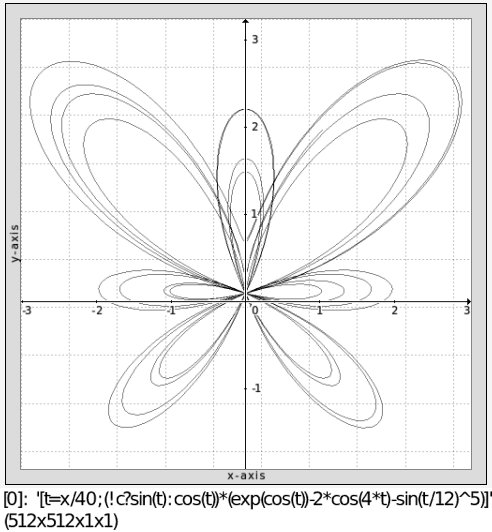
• Example #1
1024,1,1,2,'t=x/40;(!c?sin(t):cos(t))*(exp(cos(t))-2*cos(4*t)-sin(t/12)^5)' display_parametric 512,512
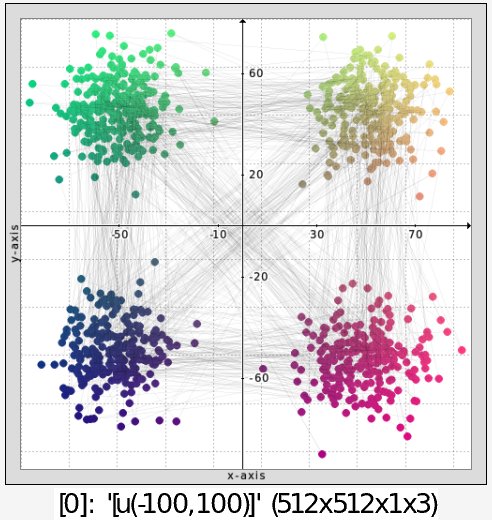
• Example #2
1000,1,1,2,u(-100,100) quantize 4,1 noise 12 channels 0,2 +normalize 0,255 append c display_parametric 512,512,0.1,8