| Table of Contents ▸ List of Commands ▸ Input / Output ▸ display_graph | ◀ display_fft | display_histogram ▶ |
display_graph
Arguments:
- _width>=0,_height>=0,_plot_type,_vertex_type,_xmin,_xmax,_ymin,_ymax,_xlabel,_ylabel,_frame_size>=0
Description:
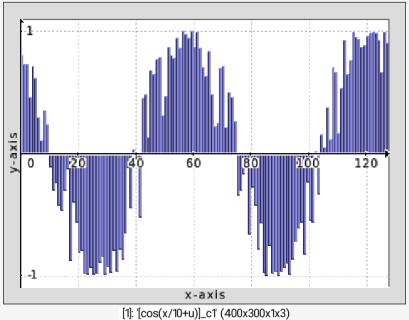
Render graph plot from selected image data.plot_type can be { 0:None | 1:Lines | 2:Splines | 3:Bar }.
vertex_type can be { 0:None | 1:Points | 2,3:Crosses | 4,5:Circles | 6,7:Squares }.
xmin,xmax,ymin,ymax set the coordinates of the displayed xy-axes.
if specified width or height is 0, then image size is set to half the screen size.
Default values:
width=0, height=0, plot_type=1, vertex_type=1, xmin=xmax=ymin=ymax=0 (auto), xlabel="x-axis", ylabel="y-axis" and frame_size=32.
Example of use:
128,1,1,1,'cos(x/10+u)' +display_graph 400,300,3


 Home
Home Download
 News
News Mastodon
 Bluesky
 X
X Summary - 17 Years
 Summary - 16 Years
 Summary - 15 Years
 Summary - 13 Years
 Summary - 11 Years
 Summary - 10 Years
 Resources
 Technical Reference
 Scripting Tutorial
 Video Tutorials
 Wiki Pages
 Image Gallery
 Color Presets
 Using libgmic
 G'MIC Online
 Community
 Discussion Forum (Pixls.us)
 GimpChat
 IRC
IRC Report Issue
