for (+)
 | The -for <loop scope> -done commands form a syntactical unit that repeatedly tests the mathematical expression argument given to -for and, if True, executes the in-scope commands, if any. The <loop scope> need not be populated and is a placeholder when empty. -for…-done expresses a "test, then perform" pattern. With the conditional test at the top of the loop, the in-scope commands won't execute at all if -for's argument first resolves to False. For a "perform, then test" pattern. consider do … while. If the contemplated conditional test entails simply incrementing or decrementing a counter, consider -repeat…-done instead, which has such counters built in. -for…-done is better for less straight forward circumstances, such reacting to changes in image conditions. Prior to 2.6, -for would test file system references. This is no longer supported. Use the file system mathematical expressions isfile() or isdir() instead. |
Examples
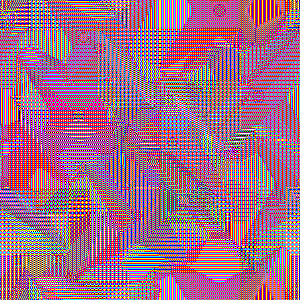
One common use entails running a process until an image metric reaches a certain value. With -convolveuntil we repeatly convolve-and-normalize an image containing unit impulses with an (approximate) Airy disk. This particular kernel amplifies differences in images. | convolveuntil: -300,300,1,1 # Zero image with unit impulses. -noise 0.01,2 -abs. -input 3,3,1,1,-0.125 # 3×3 Airy Disk for -set. 1,1,1 # repeated convolutions. -for abs(im#-2)<=0.72 # Convolve until image -convolve.. [-1],2,1 # minimum falls to -0.72. -done -remove. -normalize. 0,255 |
Variance: Dispersion From The Expected
Informally, Variance reflects the dispersion of observed values from an expected value, often, but not necessarily, their collective average — even more informally, their "sprawl". For example, if all observed values equal the expected value then there is no dispersal and the variance is zero.On the other extreme, where there are only black (0) or white (1) values, the expected value of the ensemble may very well be one half, but nary an observation actually fits such a value; they fall to one extreme or the other. In this example, the variance is 0.25 and stems from how the variance of an ensemble is computed:

where µ is the expected value and the xi are instances from the ensemble of n observed values. If we take the expected value to be the image mean, then both black and white observations vary from this mean by 0.5 absolute. The average of these squared differences is 0.25. Note that an "expected value" is just that: an observer's wish about ensembles, possibly untethered from any reality. A large variation could then serve as the observer's reality check.
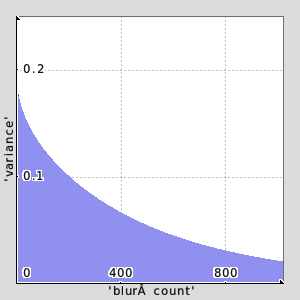
With some squinting, a decrease in variance from an initial reference value could reflect the amount of blurring that has been applied to an image, with a blurred-beyond-any-hope-of-redemption coinciding with a variance of zero. -bluruntil produces a decay curve illustrating how a successively blurred image trends toward an unvarying tonality, though it may never reach variance zero. The command accepts (1) the length of one side of a square test image, not otherwise shown (2) the number of times to blur the test image (3) a target "fully decayed variance", (4) the arguments one would pass to -blur. The command either stops when the specified variance decays to the target variance or the number of blur attempts reaches the number of trials we wish to attempt. These last two tests constitute the heart of a math expression which we present as an argument to -for. See the following:
 | bluruntil: check "isint(${1=128})>0 && \ isint(${1=128})>0 && \ isnum(${3=1})>0 && \ isnum(${4=1})>0 && \ isbool(${5=1}) && \ isbool(${6=0})" $=limit_ sigma={0.25*$limit_1} -input $limit_1,$limit_1,1,1 -name. blurbox -gaussian[blurbox] $sigma,$sigma,0 -threshold[blurbox] 50% curvar={stats(#0)[3]} -input $limit_2,1,1,1 -name. varlist arycnt=0 -for ($curvar>$limit_3)&&($arycnt<$limit_2) -blur[blurbox] $limit_4,$limit_5,$limit_6 curvar={stats(#0)[3]} -set[varlist] $curvar,$arycnt,0,0 arycnt+=1 -done -display_graph[varlist] 300,300,3 |
Command Reference
$ gmic -h for
for (+):
condition
Start a 'for...done' block.
Example:
[#1] image.jpg rescale2d ,32 400,400,1,3 x=0 for $x<400 image[1] [0],$x,$x x+=40 done
for (+):
condition
Start a 'for...done' block.
Example:
[#1] image.jpg rescale2d ,32 400,400,1,3 x=0 for $x<400 image[1] [0],$x,$x x+=40 done


 Home
Home Download
 News
News Mastodon
 Bluesky
 X
X Summary - 17 Years
 Summary - 16 Years
 Summary - 15 Years
 Summary - 13 Years
 Summary - 11 Years
 Summary - 10 Years
 Resources
 Technical Reference
 Scripting Tutorial
 Video Tutorials
 Wiki Pages
 Image Gallery
 Color Presets
 Using libgmic
 G'MIC Online
 Community
 Discussion Forum (Pixls.us)
 GimpChat
 IRC
IRC Report Issue