-bandpass
 This command isolates a band of frequencies in an image's spectral representation and then re-renders it spatially. The details of the new image are just those attuned with frequencies included in the chosen band. These images typically have negative minimum values and average values very near zero, so often need to be adjusted for display.
The format of the bandpass command is:
-bandpass fcl[%],fcu[%]
Defaults: fcl = 0 fcu = 20%
Two parameters, each relative frequencies, set the lower and upper boundaries of the passband, the chosen spectral region. A relative frequency of 1.0 (100%) corresponds to a pixel wavelength equal to the square root of 2.0, approximately 1.4142136. On the low end of the spectrum, the average value of an image, a constant bias level over the entire image, may be thought of as having an infinite wavelength and a relative frequency of zero (0%).
Cutoff wavelengths, λ, measured in pixels, establish the smallest and largest wave lengths in a bandpass-filtered image. These equate to relative frequency, ωr, through:
 to relative frequency")
when the pixel depth of the image is one. If the wavelengths in a filtered image need to fall within the range of four to ten pixels, then the lower cutoff wavelength is ten pixels and corresponds to a frequency of 0.027053. Concurrently, the upper cutoff wavelength is four pixels and the corresponding frequency is 0.161237; the following command establishes the requested passband:
-bandpass 0.027053,0.161237
The "W&B" monograph at the beginning of this article shows the command's effect.
Theory
Images have representation in both spatial and spectral domains. The Fourier Transform ('Fourier analysis') translates images from their spatial to spectral representations, the domain where the -bandpass command operates. The -bandpass command performs spectral filtering, preserving certain spectral coefficients and zeroing others out, The inverse Fourier Transform ('Fourier synthesis') returns the spectrally modified image to the spatial domain, where the effects of the spectral filtering are realized.
The spatial representation is closely allied with how we see objects in space. A pixel constitutes a definite space point, offset with respect to an origin by length, height and depth coordinates, and marked with a particular hue. One could regard a large rectangular array of such pixels, in aggregate, 'painting' the image one point at a time.
From such a collection of regularly spaced samples, Fourier analysis finds analogous spectral coefficients. These correspond to spatial domain sine curve wave forms of various frequencies, scalings, orientations, and phases that, in aggregate, also 'paints' the image, though not by one point at a time, but through constructive reinforcement and destructive interference of aptly chosen waveforms. The inverse transform, Fourier synthesis, finds such an apt set of waveforms in the spatial domain when given a set of coefficients in the spectral domain.
A large class of filtering schemes may be effected by manipulating spectral coefficients. -bandpass is one such, serving as a front-end to -fft and -ifft, respectively G'MIC's Fourier analysis and synthesis commands. In operation, the -bandpass command composes a boolean mask; those coefficients falling into the pass part of the mask are preserved, and are set to zero otherwise. These masks appear as rings around the spectral origin, the lower and upper boundary frequencies of the passband command corresponding to the inner and outer radii of the rings. Spectral coefficients falling within such rings are preserved, those falling outside are set to zero. Since these radii are measured off from the origin of the spectral domain, their lengths correspond to lower and upper cutoff frequencies.
The spatial waveforms arising out of such elided sets of coefficients only partially paint the image, the collection of wave forms corresponding to those spectral coefficients preserved by the mask. The effects of this depend primarily on the chosen lower and upper cutoff frequencies and the magnitude of their differences.
Examples
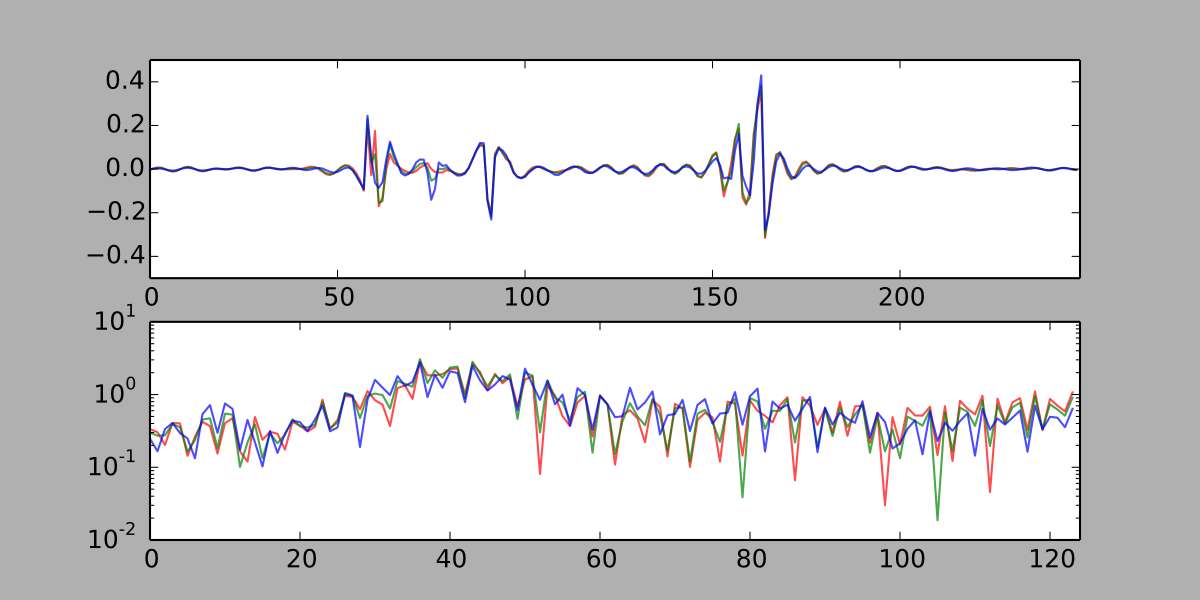
The following gallery shows how a canonical image changes though various -bandpass spectral filters. The red horizontal line marks a particular pixel row. The graphs below depict the row in both the spatial (top) and spectral (bottom) domains.
 |
 |
 |
 |
| Unfiltered image |
Low pass (infinite to 42 pixel wavelength)
...-bandpass 0,0.001547...
|
 |
 |
 |
 |
|
High pass (7 to 1.4142 pixel wavelengths)
...-bandpass 0.054662,1...
|
Wide band (74 to 2.149 pixel wavelength)
...-bandpass 0.0005,0.5...
|
 |
 |
 |
 |
|
Low pass notch (32 to 20.78 pixel wavelength)
...-bandpass 0.00266,0.00631...
|
High pass notch (4.0 to 2.0 pixel wavelength)
...-bandpass 0.161237,0.565826...
|
Application
It was customary in old maps to indicate water by a series of caustic lines radiating out from the shoreline, growing finer and more widely spaced further from the shore. It was labor intensive, but in the absence of color, a necessary sacrifice of time to indicate where the bodies of water were. The practice faded with the arrival of colored inks.
With the bandpass command, such lines arise as a matter of course, and effect that can be seen in many of the examples, above. The following command produced the effect on the right, an excerpt from a much larger image (4096x4096).
gmic lm.png --bandpass[-1] 0.07,0.3 [0] -n[-1] 0,1
 -mul[-2,-1] --gradient_norm[-1] --unsharp_octave[-1] 7,30,20
 --lt[-1] 15 -normalize[-1] 0,255 -o[-1] lmc.png
The starting artwork (lm.png) is a bivalue black (0x00) and white (0xFF) image of curvy blobs – presumptive "landmasses."
 |
The initial Image: "Old Head at Kinsdale"
|
 |
--bandpass[-1] 0.07,0.3...
This command translates the image into the spectral domain and supresses all coefficients save those within a ring around the origin between a lower radius of 0.07 and an upper radius of 0.3, a passband which admits wavelengths from 6 to 2.86 pixels. The result is a ringing pattern around black/white transitions.
|
 |
...[0] --n[-1] 0,1 -mul[-2,-1]...
To distinguish "land" from "sea", we harness the original bilevel image as a mask, normalizing it to the range of zero to one. When we multiply the penultimate and last pipeline images (landmasses and mask, respectively), the effects of the bandpass command are masked out in zero regions, by fiat, corresponding to "land."
|
 |
...--gradient_norm[-1]...
The misuse of the -gradient_norm command is justified through artistic license, in that it acts like a frequency doubler of the prototype water patterns.
|
 |
...--unsharp_octave[-1] 7,30,20...
As with -gradient_norm, -unsharp_octave increases the dynamic range of the pattern as well as sharpening it.
|
 |
...--lt[-1] 15 -normalize[-1] 0,255 -o[-1] lmc.png
A logic command, -lt 15 (less than intensity level 15). generates bivalue "True/False" images; pixels obtain either a zero or a one value. Since it is true that most pixels in the image have intensities less than fifteen, the image becomes largely white ("True"), except for the more intense wave traces around the land and the shoreline itself. The logic command, then, achived an image reversal and extracted the final pattern: two operations for the price of one.
|
Garry Osgood